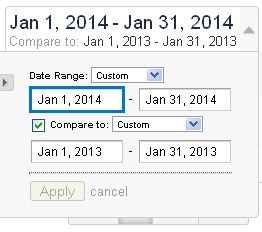
 Anyone that has over a year of Google Analytics data compiled for their website should check this out from time to time, and more than that if you’re trying to be proactive with your website. You can compare data from one time period (let’s just say January 2014) with another time period – most easily, by either the very previous similar time period, or the same time period a year before (say, January 2013). There’s a variety of reasons you might compare the same month from two years:
Determine trends of increased or decreased site usage
Measure whether new or returning visitor rates are changing
Discover changes in site point-of-entry pages
Look at mobile user rates
etc., etc., etc.
If a given month always has something special for your organization – for example, a membership drive, an event registration, an online sale – you can also try to determine how effective you have been in getting the word out about it, from year to year.
You may also be able to figure out impact of external forces on your site’s usage. I can compare about 50 sites at a time using this time period comparison, and 2 stand out with big increases in traffic in January 2014 over January 2013, and both of those increases look (although I would have to look deeper into it for better detail) to be due to the fact that this year’s weather in our state has been a LOT messier than last year’s in January. News stories, a quality link from a high profile web site, and the activities of other organizations are just a few other reasons why one year may have a timeline blip over another.
Especially if your organization has a campaign cycle for some reason that occurs on a regular schedule from year to year, the time period comparison can be helpful. You can measure after a mailing, for example, or an email blast. Take a look at yours – you may be surprised at what it tells you.